March is here and that means:
• March Madness! The “Big Dance” (NCAA basketball tournament) is upon us! This year, six of the ten Big Twelve teams were selected to be in the NCAA Men’s Basketball Tournament including Texas, Texas Tech, Baylor, Kansas, TCU, and Iowa State. Other Texas teams selected were the University of Houston, Texas Southern, and Texas A&M Corpus Christi. This year, Kansas (my alma mater) and Baylor are #1 seeds in two of the regionals. Texas, Texas Tech and TCU are all playing well and may make a deep run in the tournament. My other alma mater, Duke, has had a rough end to the season which is disappointing since it is Coach K’s last season. Jerry’s other alma mater, North Carolina, is a possibility too. We have many great teams to follow (check bracket here)—this should be fun!!
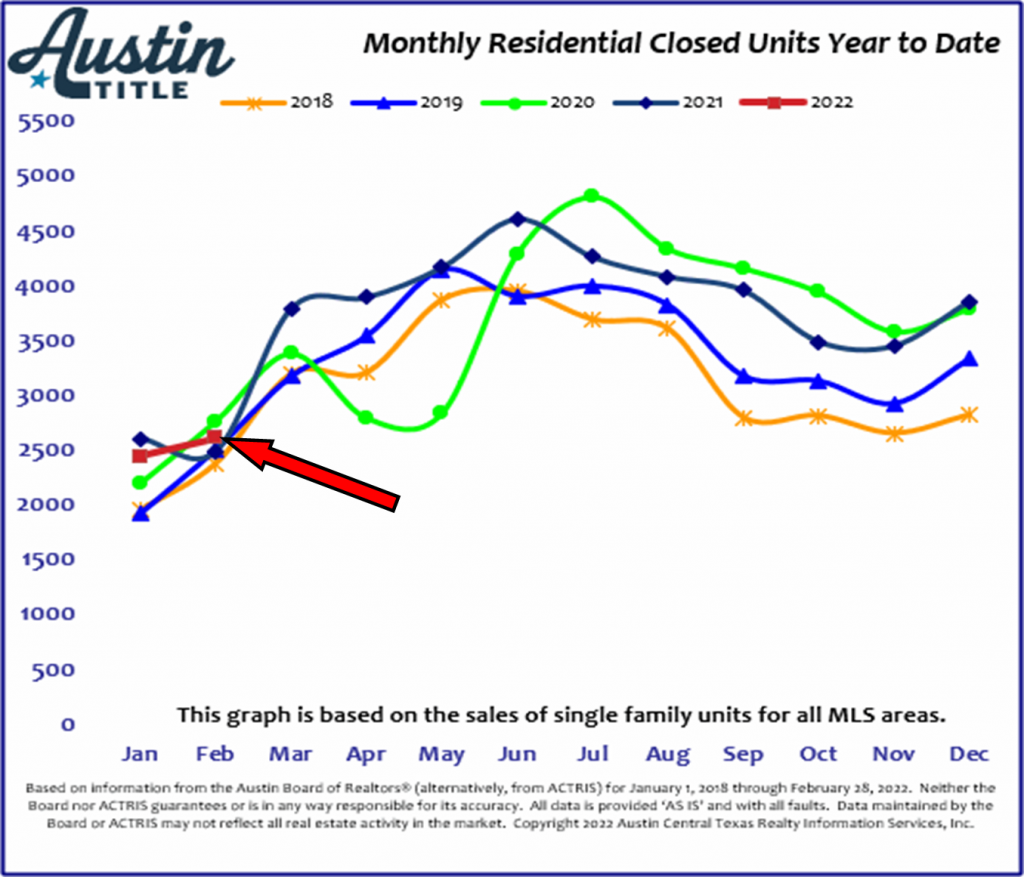
• Market update time: The market continues to be “insane, crazy, incredible, nuts, and unbelievable”. Preliminary sales results for February are in—note the chart from Austin Title below. The number of sales in January fell below those of January 2021, yet they were still well above 2020. The February sales numbers are above those of February, 2021 which saw a short-lived dip. The incredibly low inventory is keeping the number of sales lower than the sales numbers would reflect.
Demand is keen in spite of the jaw-dropping average and median price increases in 2021 (see the information on the opposite side). Prices continue to increase. My listing at 4820 Rollingwood Drive, a 1960’s fixer-upper or tear-down with a lot of .35 acres and listed at $2.2 million had multiple offers on day 1 of the market, and it is under contract with multiple offers well over list price. (That was in the marketing plan!)
Many local sellers continue to sit tight as there is nowhere to move. Buyers face the question of “How badly do we want this property, and what are we willing to do to secure it?” as they compete with so many other buyers.
In addition to the information on the opposite side, check the “News/Blog” on my website https://bettyhood.com/news-blog/ for more information on the market, trends, predictions, and more. The post which has caught the eye of many is the February 8 post which includes a year-over-year percentage sale price increase by zip code.
As always, it is a joy to be your REALTOR® and friend and an honor to assist you in your real estate strategies. Call/text/email me if you are thinking about real estate or if you know someone who needs valuable representation in buying/selling.
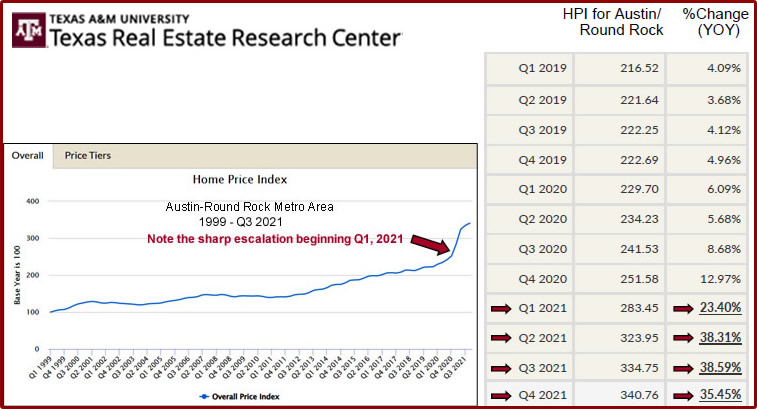
The graph below shows The Home Price Index (HPI) for the Austin-Round Rock metro area from 1999 to Q3 2021. The HPI was introduced in 1996 and is a measure of real estate prices that provides a clearer picture of market trends over traditional tools such as mean or median average prices. The chart to the right shows the details by quarter of the last three years. Note the dramatic increase in the year-over-year percentage change in 2021.
As a note: the best place to look for real estate data and statistics for the state of Texas, Texas cities, and areas of Texas in general is the Texas A&M Real Estate Research Center a https://www.recenter.tamu.edu. This is what they do!
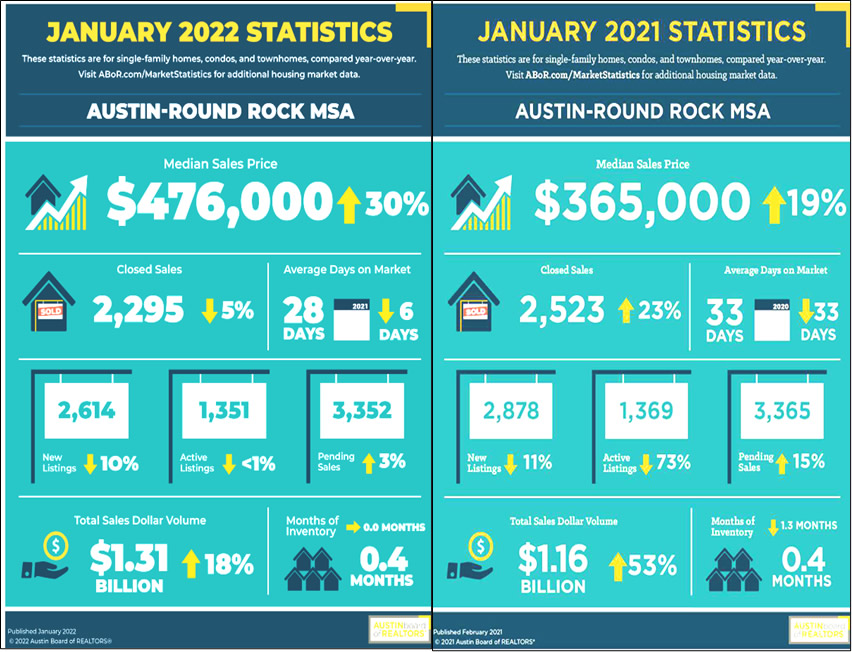
From The Austin Board of Realtors:
The two reports below show side-by-side market information of the Austin-Round Rock Metro areas: the far left is from January 2022 and the other is January 2021.
Of particular note:
• The number of active listings in January 2021 was down 73% year-over-year (YOY), and the number in January 2022 dropped another 1% from there, despite the addition of more homes in the area
• Total sales volume was up 53% in January 2021 and up an additional 18% in January 2022.
• Inventory is critically low; a balanced market is 4-6 months of inventory in Austin. We are at 0.4 months or less.
• Pending sales in January 2022 were down slightly, likely due to the lack of inventory.